Last updated on Jun 20th 2023
Tips to Follow for Freshers Before an Accounting Interview
Initial finance and accounting interviews can be hard-hitting and you don’t want to be caught off-guard. Here, we’ve compiled top 11 tips to follow for freshers before an accounting interview.
For obvious reasons we have not added the must-haves such as “hard work” & “dedication”. This list has been curated from real-life experiences and hopes to help you to achieve more out of your accounting interviews.
10. Revise your basics
Top grades in academics do not guarantee success in accounting and finance interviews. This is the main reason why we strongly suggest that you revise fundamentals of accounting and finance before your next encounter with an interviewer.
The idea is to avoid taking it for granted and never be complacent with yourself. You can subscribe and receive a free eBook with top 40 accounting interview questions asked by major companies around the world.

9. Know Your Job Profile – Don’t Be Trapped
This is one of the most important tips to follow for freshers before an accounting interview. A lot of freshers are prone to getting into the WRONG type of jobs because of not being able to handle the anxiety of starting a professional career.
A finance student getting into marketing, human resources, customer care, operations, and other unrelated work profiles is not the best way to kickstart a career.
It is highly advisable that you research your role & job profile. What are you expected to do 9 to 5? how are you going to spend a regular day at work? etc. Trust us, you don’t want to feel trapped and be sorry for your decision later on. It is also important because it allows you to anticipate questions and prepare precisely for the technical rounds.

8. Exhibit Stability
You may not have applied for the exact role you’ve always wanted, however, this isn’t something you need to convey to the interviewers. Talking about IJPs (Internal Job Postings), future plans, anything which shows that you’re not going to stay in this role for long is a strict NO!
Be careful about revealing your future plans, a lot of students get excited and start talking about fancy courses such as CPA, CA, CMA, ACCA, CFA, etc. that they are pursuing. Don’t get amazed to know that this is only a red flag in the eyes of the interviewer. There are however exceptions to this scenario where a specific course may be a plus for your role. Only reveal if you’re 100% sure about it.

7. Stay Motivated
You may have the best preparation and extraordinary educational background but on the day of the interview, you still need the unseen & intangible forces to work in your favour.
add motivation to the right attitude and the see the magic happen!
To reduce nervousness, stress, and anxiety related to an interview, we recommend that you try to watch motivational videos or do anything that makes you feel confident and positive.

6. MS-Excel
Most finance and accounting roles require you to work extensively with MS-Excel. Therefore, most of the accounting and finance interviews have at least one round related to Microsoft Excel.
Few functions we recommend every fresher should be comfortable with are Sort, Filter, Concatenate, Vlookup, Hlookup, Pivot (basics), Conditional Formatting, Text to Column, Charts, Sumif, Countif, Left, Right, Mid, Trim, etc.
The above is not an exhaustive list but covers most of the major functions. Also, consider learning some basic excel shortcuts.
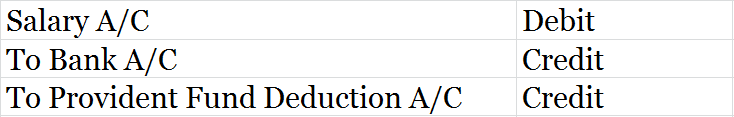
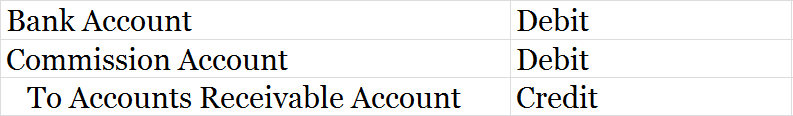
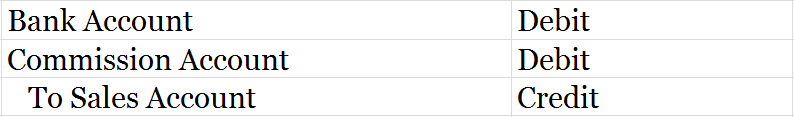
5. Journal Entries
For accounting students, this is your holy grail. There is almost no way that an accounting interview can exist without journal entries. Not only are you expected to be good with accounting fundamentals but you are also required to display superior journal entry skills.
We have a list of journal entries here that can help you prepare. Along with basic entries, the operations manager love to ask accrual related entries don’t forget to prepare them.

4. Don’t Overtalk & Embrace Smartwork
Overtalking rarely helps, more often than not we end up saying things that we didn’t want to or we reveal more than required. Please avoid this.
Staying Quiet at the right time is an uncommon tact
Nothing beats a combination of Smart Work and Hard Work. For example, if you are anticipating a group discussion in your interview make sure you’ve researched the best practices, to-dos, etc. related to a GD. Don’t be shy to Google and learn something new.

3. Communication Skills
More than 70% of rejections happen in the preliminary rounds where the people from the human resource department churn out the applicants. The biggest reason for rejection in Non-English speaking countries still remains “Poor Communication Skills”.
Few resources for improvement we recommend are; watching movies, reading, youtube channels, online courses on UDEMY, online certifications at COURSERA, etc. This is one area that requires persistence and constant practice.

2. Research About the Company
Don’t forget to research about the company, mainly, its main line of business, history & top management. The best way to do this is through Wikipedia or the company’s own website.
Be ready with a crisp and natural answer to this question “Why do you want to join our organization?”

1. Rejection isn’t the end of World
Last in our list of tricks and tips to follow for freshers before an accounting interview is related to handling rejection. There is always a chance that your entire interview experience may have been really awesome and all your answers were perfect, but, you will still be rejected.
Accept that you can’t control everything and sometimes the reason for failure isn’t you at all. There are numerous behind the scene management-related decisions that can impact your success in an accounting interview. A few of them are – reduction in no. of positions, the job is filled up by an IJP, budget constraints, hiring manager’s personal choice, etc.
Jack Ma, Alibaba Group’s founder was REJECTED! by KFC. 
~Goodluck~
>Read Accounting Interview Questions for Freshers